Quantitative Developments
Quantitative Developments - ARMI Papers & Reports
Papers & Reports Prioritizing the risk and management of introduced species in a landscape with high indigenous biodiversity
Authors: Jonathan Q Richmond; Jennifer Kingston; Brittany Ewing; Wendy Bear; Stacie A Hathaway; Cedric Lee; Camm C. Swift; Kristine L Preston; Allison J Schultz; Barbara E. Kus; Kerwin Russel; Philip Unitt; B Hollingsworth; Robert E Espinoza; Michael Wall; S Tremor; Kai Palenscar; Robert N Fisher
Date: 2023 | Outlet: Bulletin of the Southern California Academy of Sciences
Risk analysis protocols for prioritizing the management of non-native species are numerous, yet few incorporate risk and management in the same analysis or accommodate a broad diversity of taxa outside of a specific geographic area. We adapted a protocol that accounts for these factors to address non-native animal species in the Southern California/Northern Baja California Coast Ecoregion near the international border in San Diego County, an area with high indigenous biodiversity and high numbers of species of conservation concern. This stepwise, semi-quantitative protocol is applicable to any animal group in any predefined geographic area, relies on consensus-building among taxonomic experts, and has been vetted through previous use and in peer-reviewed literature. Our results show that the final prioritization was driven mainly by management feasibility, with top-ranked species having multitrophic effects that favor other non-native invaders over native residents. Conditions within the assessment area required some modification to the protocol as it was originally designed, namely a shift in emphasis from eradication to control, given that eradication is implausible for most non-native species in the assessment area. We call attention to taxon-specific issues that surfaced during the analysis, identify areas for improvement in this first-ever risk assessment for invasive animal species in the Natural Communities Conservation Plan/Habitat Conservation Plan (NCCP/HCP) reserve system of San Diego County, and provide suggestions for further refinement of the protocol. This study builds on the effort to standardize risk analysis for invasive species globally, given that many of the same invaders present threats to indigenous biodiversity worldwide.
Papers & Reports Inferring pathogen presence when sample misclassification and partial observation occur
Authors: Evan HC Grant; Riley O Mummah; Brittany A Mosher; Jonah Evans; Graziella V DiRenzo
Date: 2023-04-11 | Outlet: Methods in Ecology and Evolution
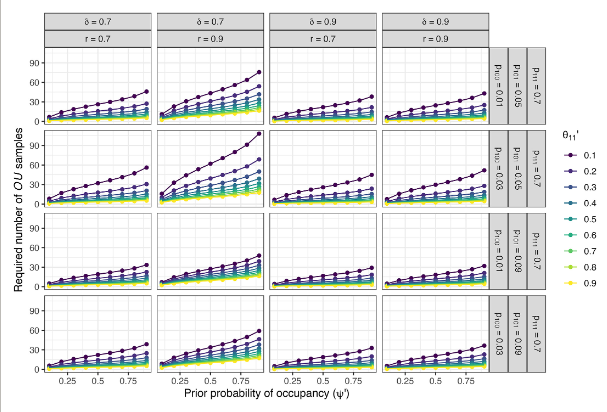
1. Surveillance programs are essential for detecting emerging pathogens and often rely on molecular methods to make inference about the presence of a target disease agent. However, molecular methods rarely detect target DNA perfectly. For example, molecular pathogen detection methods can result in misclassification (i.e., false positives and false negatives) or partial detection errors (i.e., detections with ‘ambiguous’, ‘uncertain’, or ‘equivocal’ results). Then, when data are to be analyzed, these?partial observations?are?either?discarded?or censored;?this, however, disregards information that could be used to make inference about the true state of the system. There is a critical need for more direction and guidance related to how many samples is enough to declare a unit of interest ‘pathogen-free’.
2. Here, we develop a Bayesian hierarchal framework that accommodates false negative, false positive, and uncertain detections to improve inference related to the occupancy of a pathogen. We apply our modeling framework to a case study of the fungal pathogen Pseudogymnoascus destructans (Pd) identified in Texas bats at the invasion front of white-nose syndrome. To improve future surveillance programs, we provide guidance on sample sizes required to be 95% certain a target organism is absent from a site.
3. We found that the presence of uncertain detections increased the variability of resulting posterior probability distributions of pathogen occurrence, and that our estimates of required sample size were very sensitive to prior information about pathogen occupancy, pathogen prevalence, and diagnostic test specificity. In the Pd case study, we found that the posterior probability of occupancy was very low in 2018, but occupancy probability approached 1 in 2020, reflecting increasing prior probabilities of occupancy and prevalence elicited from the site manager.
4. Our modeling framework provides the user a posterior probability distribution of pathogen occurrence, which allows for subjective interpretation by the decision-maker. To help readers apply and use the methods we developed, we provide an interactive?RShiny?app?that generates target species?occupancy estimation and sample size estimates to make these methods more accessible?to the scientific community (https://rmummah.shinyapps.io/ambigDetect_sampleSize).?This modeling framework and sample size guide may be useful for improving inferences from molecular surveillance data about emerging pathogens, non-native invasive species, and endangered species where misclassifications and ambiguous detections occur.
Data Release Calculations of BioLake climate data
Authors: Ryan C Burner; Richard E Erickson
Date: 2022-11-01 | Outlet: USGS GitLab
Climate data allow people to examine species distributions and possible distributions. This script takes ERA5-Land climate estimates (https://www.ecmwf.int/en/forecasts/datasets/reanalysis-datasets/era5) for precipitation and lake temperature and processes them to create summary climate layers for use with biological organisms in lakes. This code could be modified to use a different subset of years.
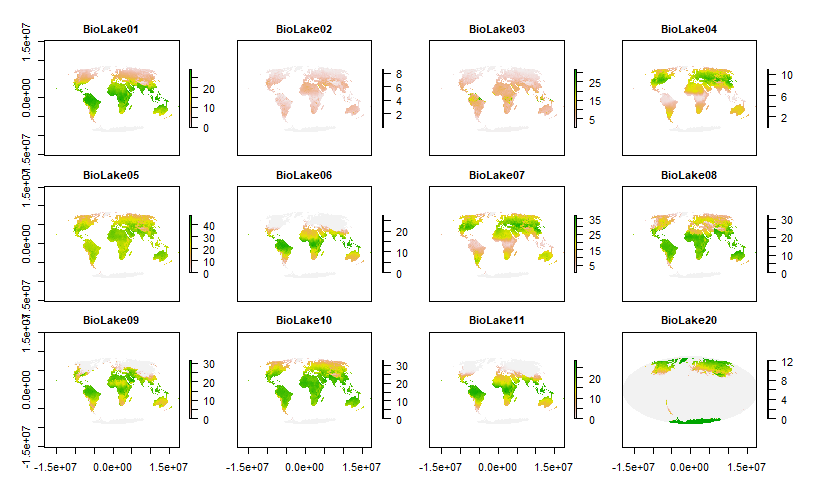
These BioLake raster data provide global estimates (~10.0 x 12.4 km resolution) of twelve bioclimatic variables based on estimated lake temperature. Eleven of these twelve variables (BioLake01 - BioLake11) are estimated for each of three lake strata: lake mix (surface) layer, lake bottom, and total lake water column. These eleven variables correspond to CHELSA (Climatologies at high resolution for the earth's land surface areas) bioclimatic variables BIO1 - BIO11, except that these BioLake variables are based on lake water temperature and CHELSA BIO1 - BIO11 variables are based on air temperature. CHELSA BIO is also calculated a finer spatial resolution (~1 x 1 km). The twelfth variable (BioLake20; months with non-zero ice cover) does not correspond to any CHELSA bioclimatic variable. The data are supplied as a multi-layer raster (.grd) file in the World Mollweide projection, accompanied by a header file (.gri) with layer names.
For BioLake layer download, see https://doi.org/10.5066/P96QLN5Y
View All Data Releases on Quantitative Developments
* USGS neither sponsors nor endorses non-USGS web sites; per requirement "3.4.1 Prohibition of Commercial Endorsement."
* PDF documents require Adobe Reader or Google Chrome Browser for viewing.
* PDF documents require Adobe Reader or Google Chrome Browser for viewing.