Search ARMI Database
Search term(s)
Contribution Number
Search Results
7 record(s) found.
Data Release Amphibian (chorus frog, wood frog, tiger salamander) surveys in Rocky Mountain National Park (1986-2022)
Authors: Amanda M Kissel; Erin Muths
Date: 2023-01-24 | Outlet: sciencebase
This data release contains information collected during surveys for chorus fogs (Pseudacris maculata), wood frogs (Lithobates sylvaticus) and tiger salamanders (Ambystoma mavortium) conducted in Rocky Mountain National Park (1986 – 2022) by the U.S. Geological Survey. Survey methods included visual encounter and aural surveys, and dip netting. Data collected between 1986 and 1994 focused on named water bodies in Rocky Mountain National Park. Data collected between 1995 and 1999 are from focal monitoring sites as well as sporadic surveys of other wetlands. Data collected between 2000-2002 represent repeated surveys conducted between 1986 and 1994 (e.g., park-wide surveys of named water bodies) and additional surveys of unnamed waterbodies. Data collected after 2002 were collected under an occupancy framework. Sites were identified within pre-defined catchments using the National Wetlands Inventory Database to locate potential amphibian breeding habitat (e.g., ponds, ephemeral wetlands). If appropriate sites were encountered in the field and were not indicated on National Wetland Inventory databases (https://www.fws.gov/program/national-wetlands-inventory/metadata), they were added as incidental sites. Waterbodies were visited and surveyed at least two times during the amphibian active season (May and mid-August). Water bodies were surveyed for all life stages of amphibians.
Data Release Data release - Abiotic and biotic factors reduce viability of a high-elevation salamander in its native range
Authors: Evan HC Grant; Graziella V DiRenzo; Adrianne B Brand
Date: 2023-04-11 | Outlet: ScienceBase
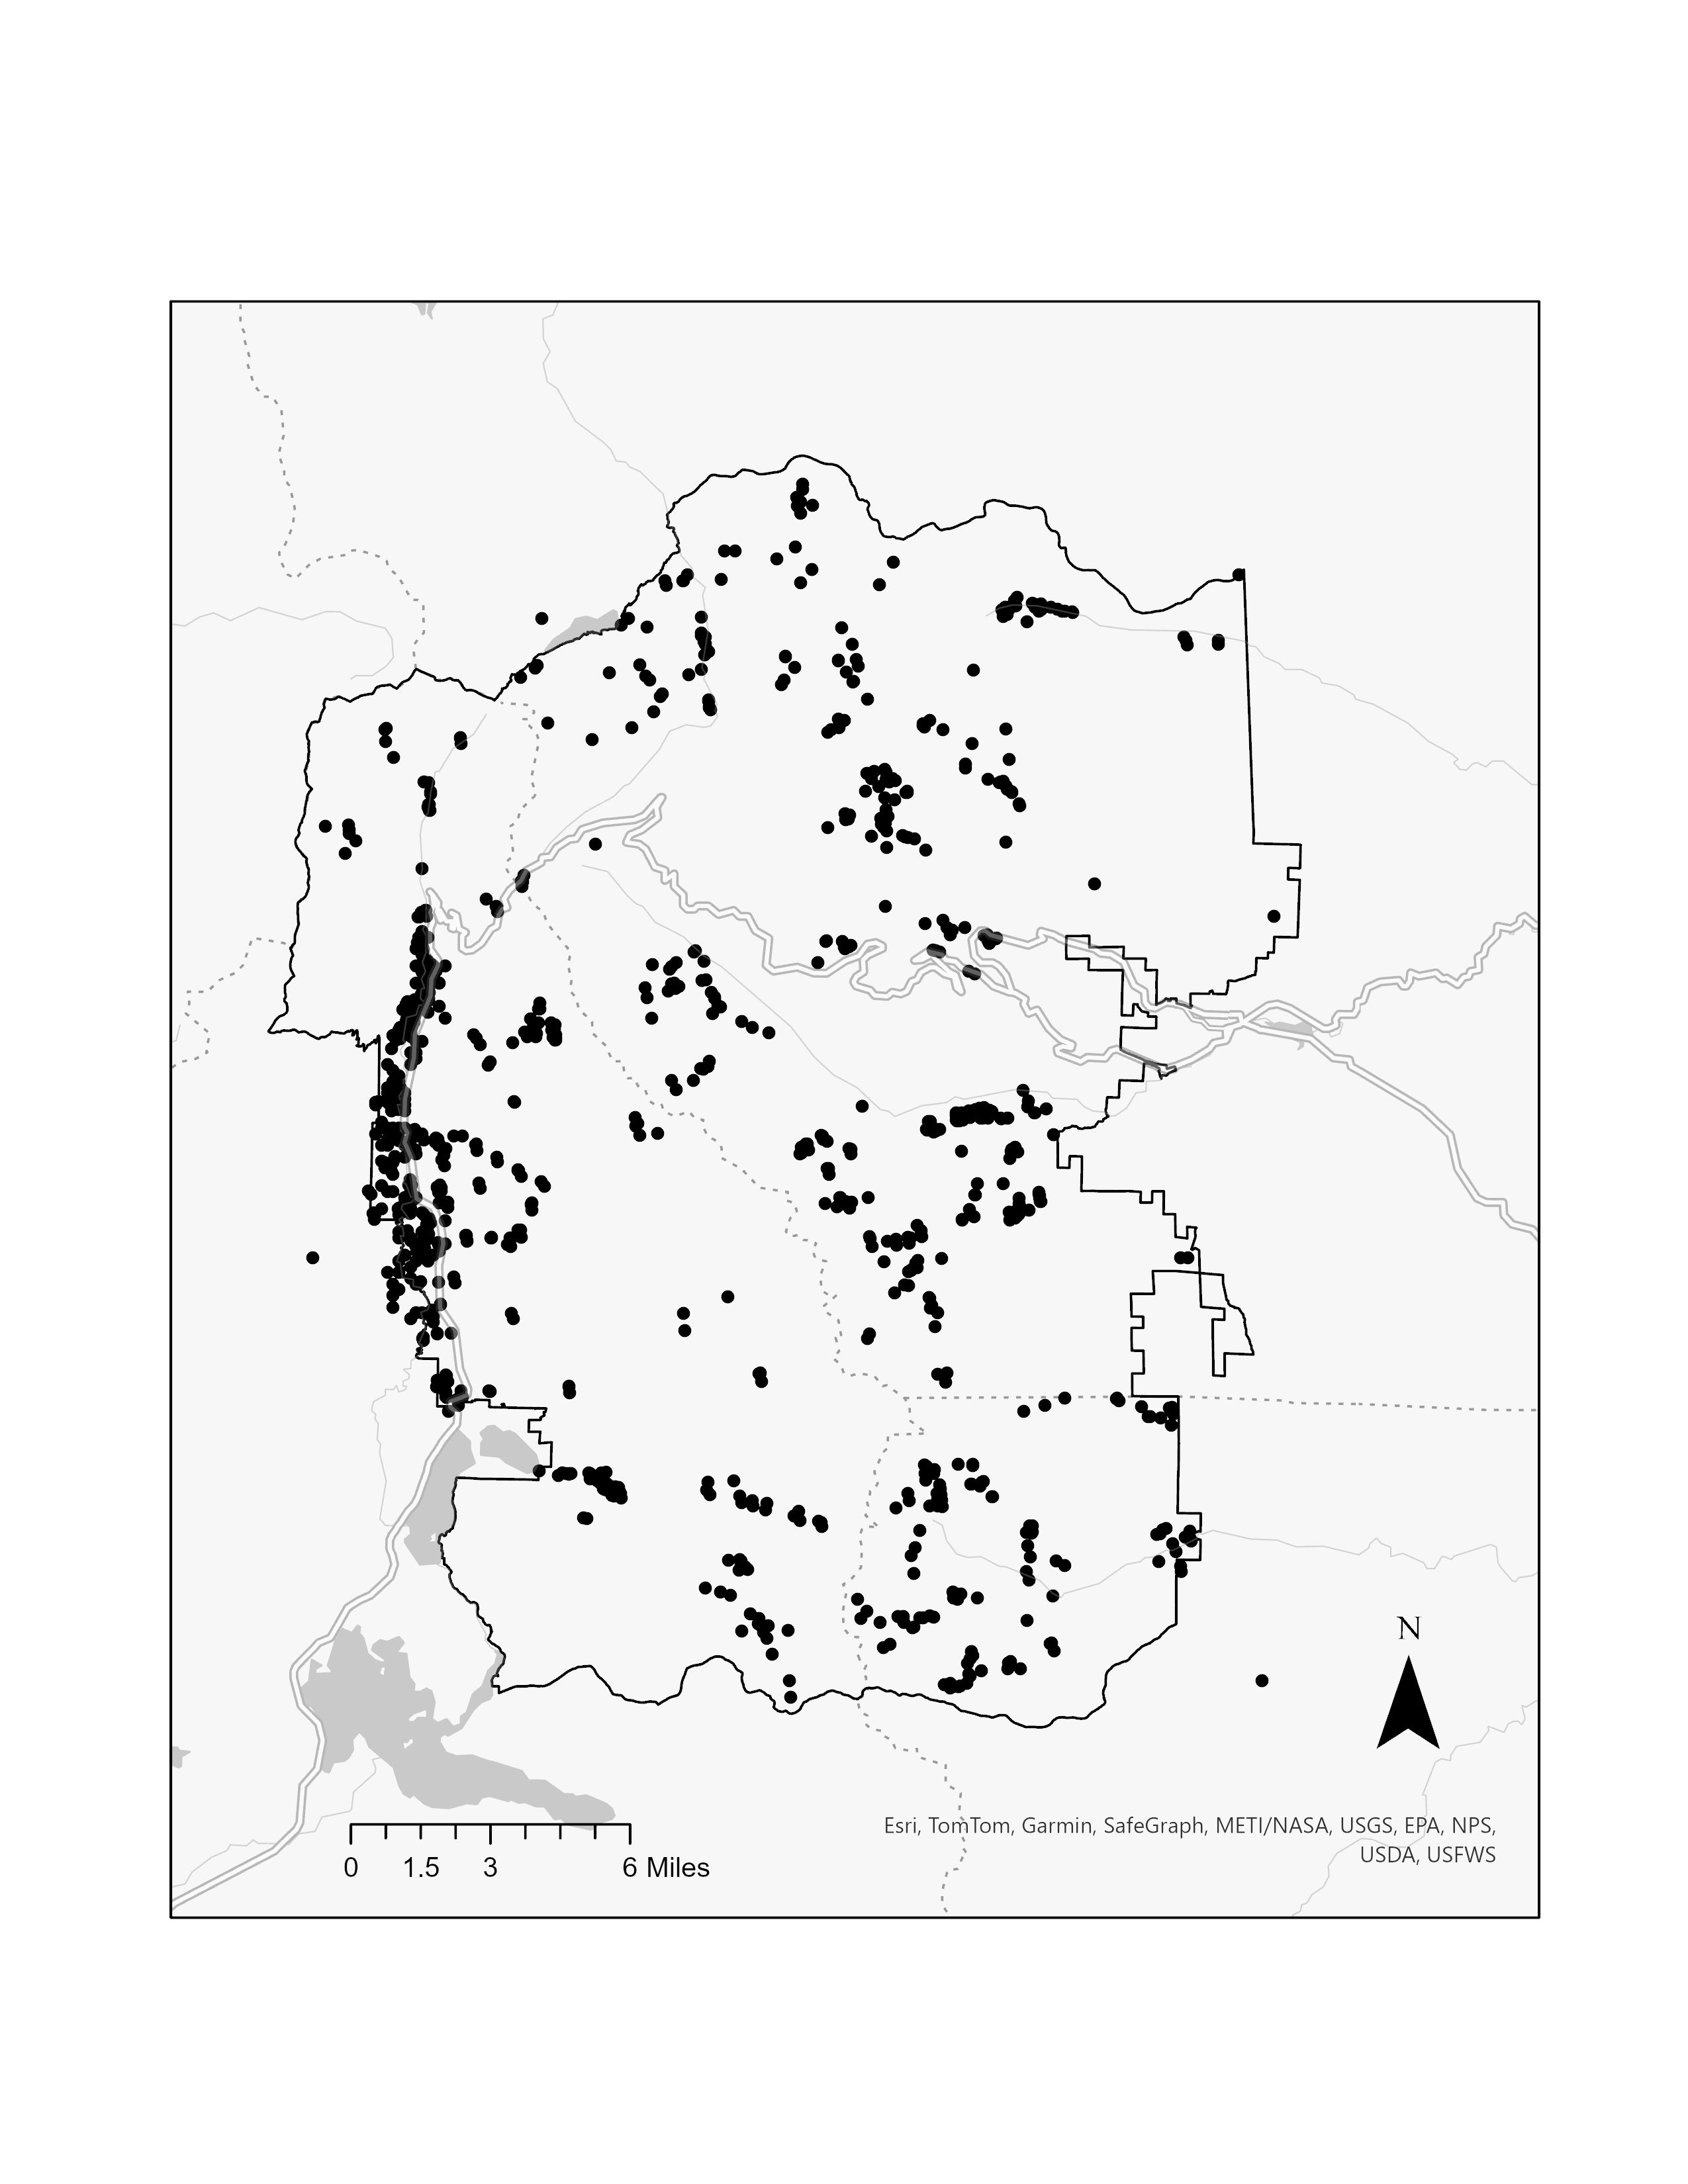
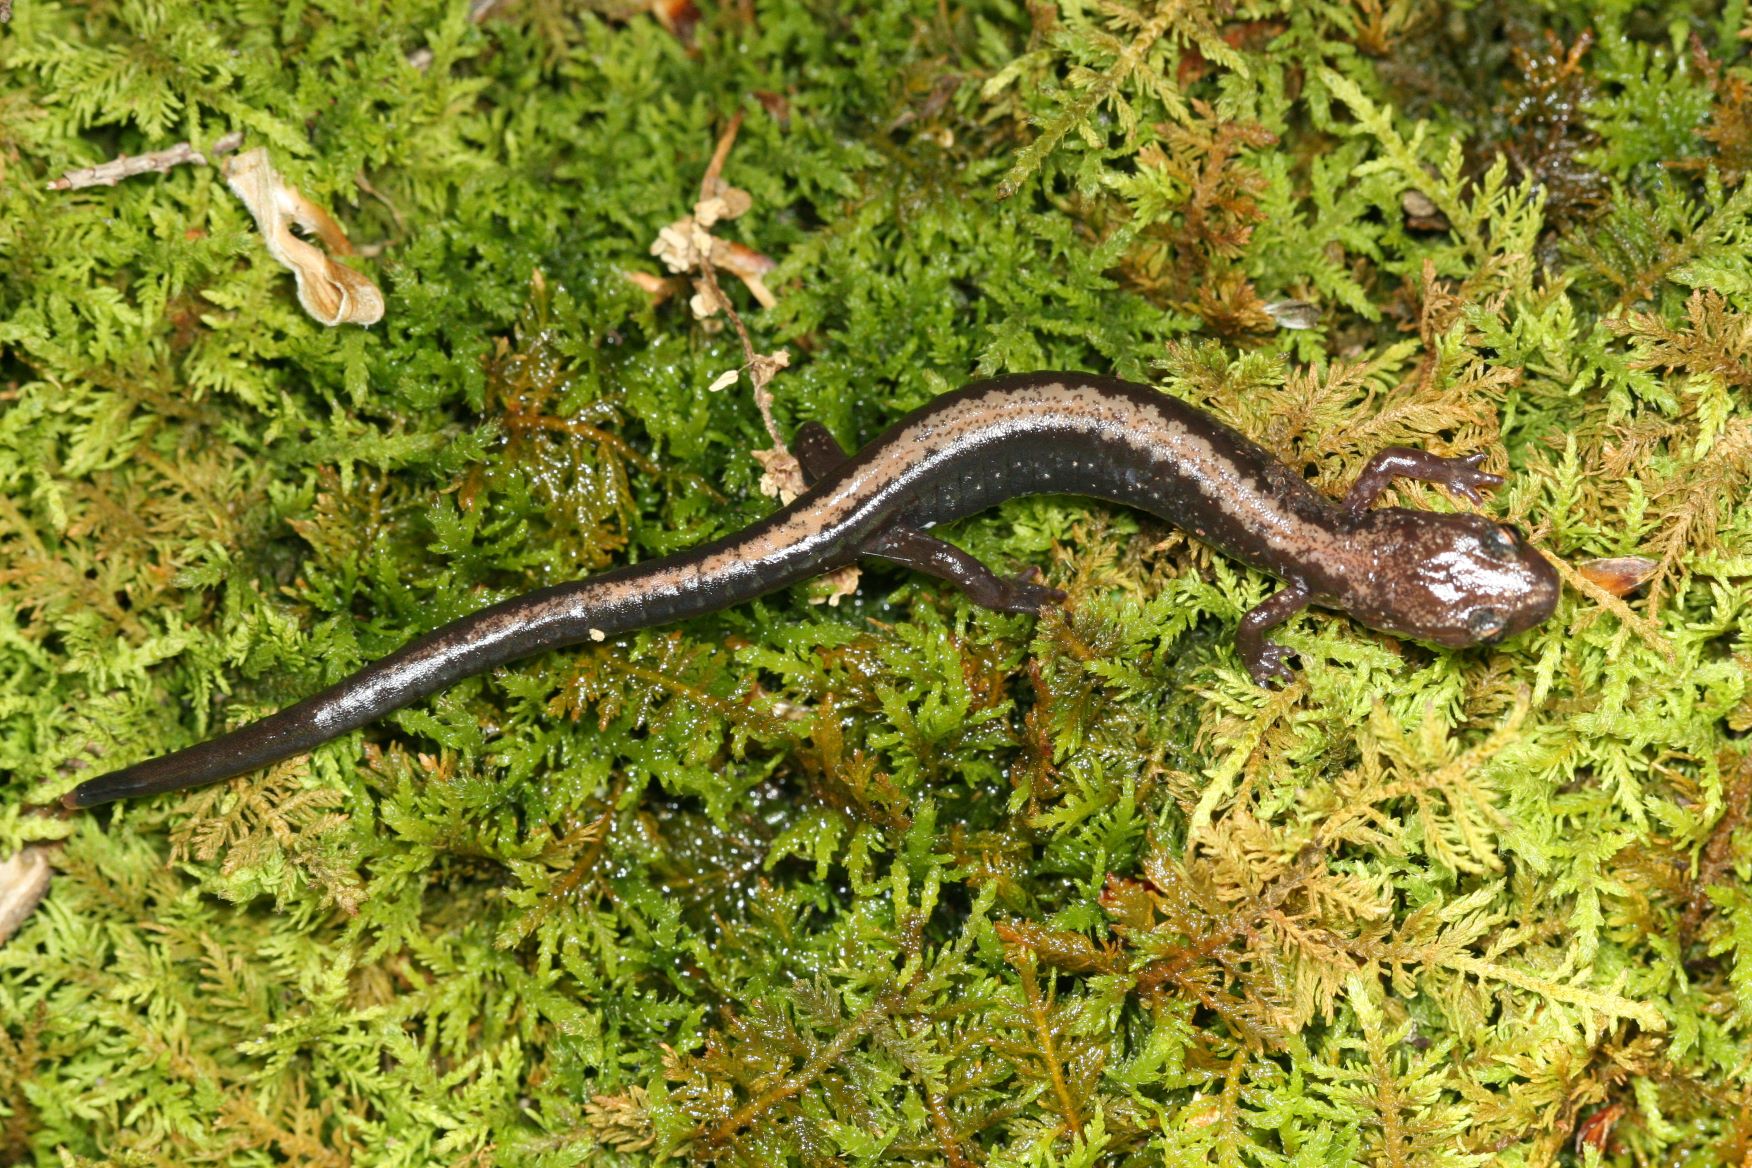
Includes data used to estimate population demographic parameters for an exemplary high-elevation amphibian species, the federally endangered Shenandoah salamander (Plethodon shenandoah). These parameters were entered into a Markov projection model which we used to forecast the future population status of the Shenandoah salamander.
Data Release Calculations of BioLake climate data
Authors: Ryan C Burner; Richard E Erickson
Date: 2022-11-01 | Outlet: USGS GitLab
Climate data allow people to examine species distributions and possible distributions. This script takes ERA5-Land climate estimates (https://www.ecmwf.int/en/forecasts/datasets/reanalysis-datasets/era5) for precipitation and lake temperature and processes them to create summary climate layers for use with biological organisms in lakes. This code could be modified to use a different subset of years.
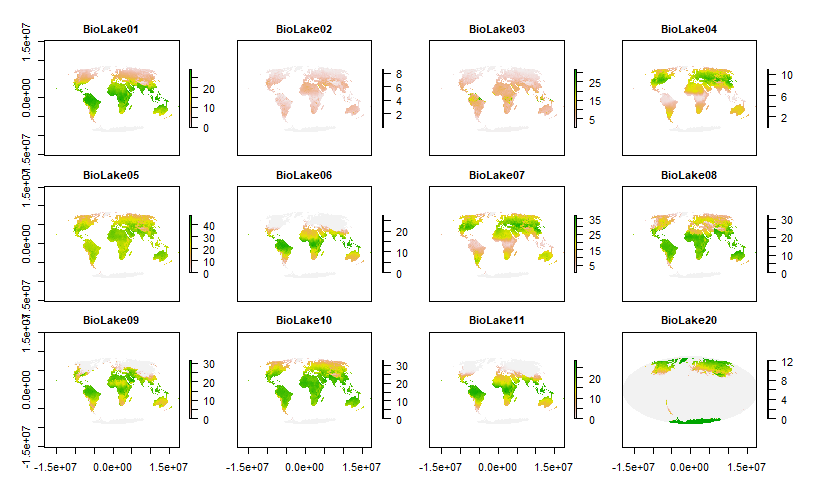
These BioLake raster data provide global estimates (~10.0 x 12.4 km resolution) of twelve bioclimatic variables based on estimated lake temperature. Eleven of these twelve variables (BioLake01 - BioLake11) are estimated for each of three lake strata: lake mix (surface) layer, lake bottom, and total lake water column. These eleven variables correspond to CHELSA (Climatologies at high resolution for the earth's land surface areas) bioclimatic variables BIO1 - BIO11, except that these BioLake variables are based on lake water temperature and CHELSA BIO1 - BIO11 variables are based on air temperature. CHELSA BIO is also calculated a finer spatial resolution (~1 x 1 km). The twelfth variable (BioLake20; months with non-zero ice cover) does not correspond to any CHELSA bioclimatic variable. The data are supplied as a multi-layer raster (.grd) file in the World Mollweide projection, accompanied by a header file (.gri) with layer names.
For BioLake layer download, see https://doi.org/10.5066/P96QLN5Y
Data Release BioLake bioclimatic variables based on ERA5-Land lake temperature estimates 1991-2020
Authors: Ryan C Burner; Richard E Erickson
Date: 2022-01-21 | Outlet: USGS ScienceBase
These BioLake raster data provide global estimates (~10.0 x 12.4 km resolution) of twelve bioclimatic variables based on estimated lake temperature. Eleven of these twelve variables (BioLake01 - BioLake11) are estimated for each of three lake strata: lake mix (surface) layer, lake bottom, and total lake water column. These eleven variables correspond to CHELSA (Climatologies at high resolution for the earth's land surface areas) bioclimatic variables BIO1 - BIO11, except that these BioLake variables are based on lake water temperature and CHELSA BIO1 - BIO11 variables are based on air temperature. CHELSA BIO is also calculated a finer spatial resolution (~1 x 1 km). The twelfth variable (BioLake20; months with non-zero ice cover) does not correspond to any CHELSA bioclimatic variable. The data are supplied as a multi-layer raster (.grd) file in the World Mollweide projection, accompanied by a header file (.gri) with layer names.
Data Release Vernal pool inundation models
Authors: Jennifer M Cartwright; TL Morelli; Evan HC Grant
Date: 2020-06
This website provides an application for exploring modeling results from a U.S. Geological Survey (USGS) project titled Mapping Climate Change Resistant Vernal Pools in the Northeastern U.S. The purpose of this project was to improve understanding of the factors that control inundation patterns in vernal pools of the northeastern United States, so as to identify pools that might function as hydrologic refugia under climate change.
Data Release Hydrological measurements of 300 US temporary wetlands from 2004-2014
Authors: Courtney L Davis; David AW Miller; Evan HC Grant; Brian J Halstead; Patrick M Kleeman; Susan C Walls; William J Barichivich
Date: 2018 | Outlet: ScienceBase
This dataset includes hydrological measurements of 300 US temporary wetlands from 2004-2014.
Data Release Seasonal median daily water depths for study wetlands in the St. Croix National Scenic Riverway, the North Temperate Lakes Long-term Research area, and the Upper Mississippi River study area from 2013-2018
Authors: Walt J Sadinski; Mark F Roth
Date: 2020-05-20 | Outlet: U.S. Geological Survey data release, https://doi.org/10.5066/P9H4VLEM
To relate water levels in our study wetlands to temperature, precipitation, wetland water depth, and amphibian calling activity, we installed one pressure logger in the deepest spot we could find in each wetland. Soon after thawing conditions allowed, we drove a plastic pipe (anchor pipe) into the sediments at the deepest location and secured another pipe to it that contained one pressure logger (Onset Computer Corporation Model U20-001-04 [Bourne, MA, USA]) suspended approximately 2.5 cm above the sediments. We installed additional individual pressure loggers in the upper part of the logger pipes (in air) at select locations to measure barometric pressure for calibrating the submerged loggers’ readings. We measured pressure once per hour and used software supplied by the logger manufacturers to upload and convert data to depth at the end of each season.