Quantitative Developments
Quantitative Developments - ARMI Papers & Reports
Papers & Reports Incorporating location uncertainty improves inference with stop-level North American Breeding Bird Survey data
Authors: Ryan C Burner; Jeffrey A. Hostetler; Alan Kirschbaum
Date: 2026-05-22 | Outlet: Ornithological Applications
Covariate uncertainty is a challenge for monitoring ecological data. Here, we test a Bayesian method for accounting for covariate uncertainty in multi-species models using informative priors. We conduct a series of simulations to evaluate the effects of incorporating covariate uncertainty into models, using the North American Breeding Bird Survey (BBS) dataset as a case study. This extensive database has annual bird point count data for over 100,000 locations annually, but the precise spatial coordinates of these locations are unknown. We find that an informative prior model produces substantially better inferences than does a simpler model that makes assumptions about locations and covariates.
Data Release Multi-species frog occupancy code
Authors: Ryan C Burner; Mark F Roth
Date: 2025-07-14 | Outlet: U.S. Geological Survey code release
This code processes frog and toad survey data from the upper Midwest and fits a Bayesian multi-species occupancy model that includes imperfect detection, species associations, and species traits. The focus in on changes in occupancy of Blanchard's cricket frog (Acris blanchardi) from the 2000s to 2024, and effects of land cover covariates on occupancy.
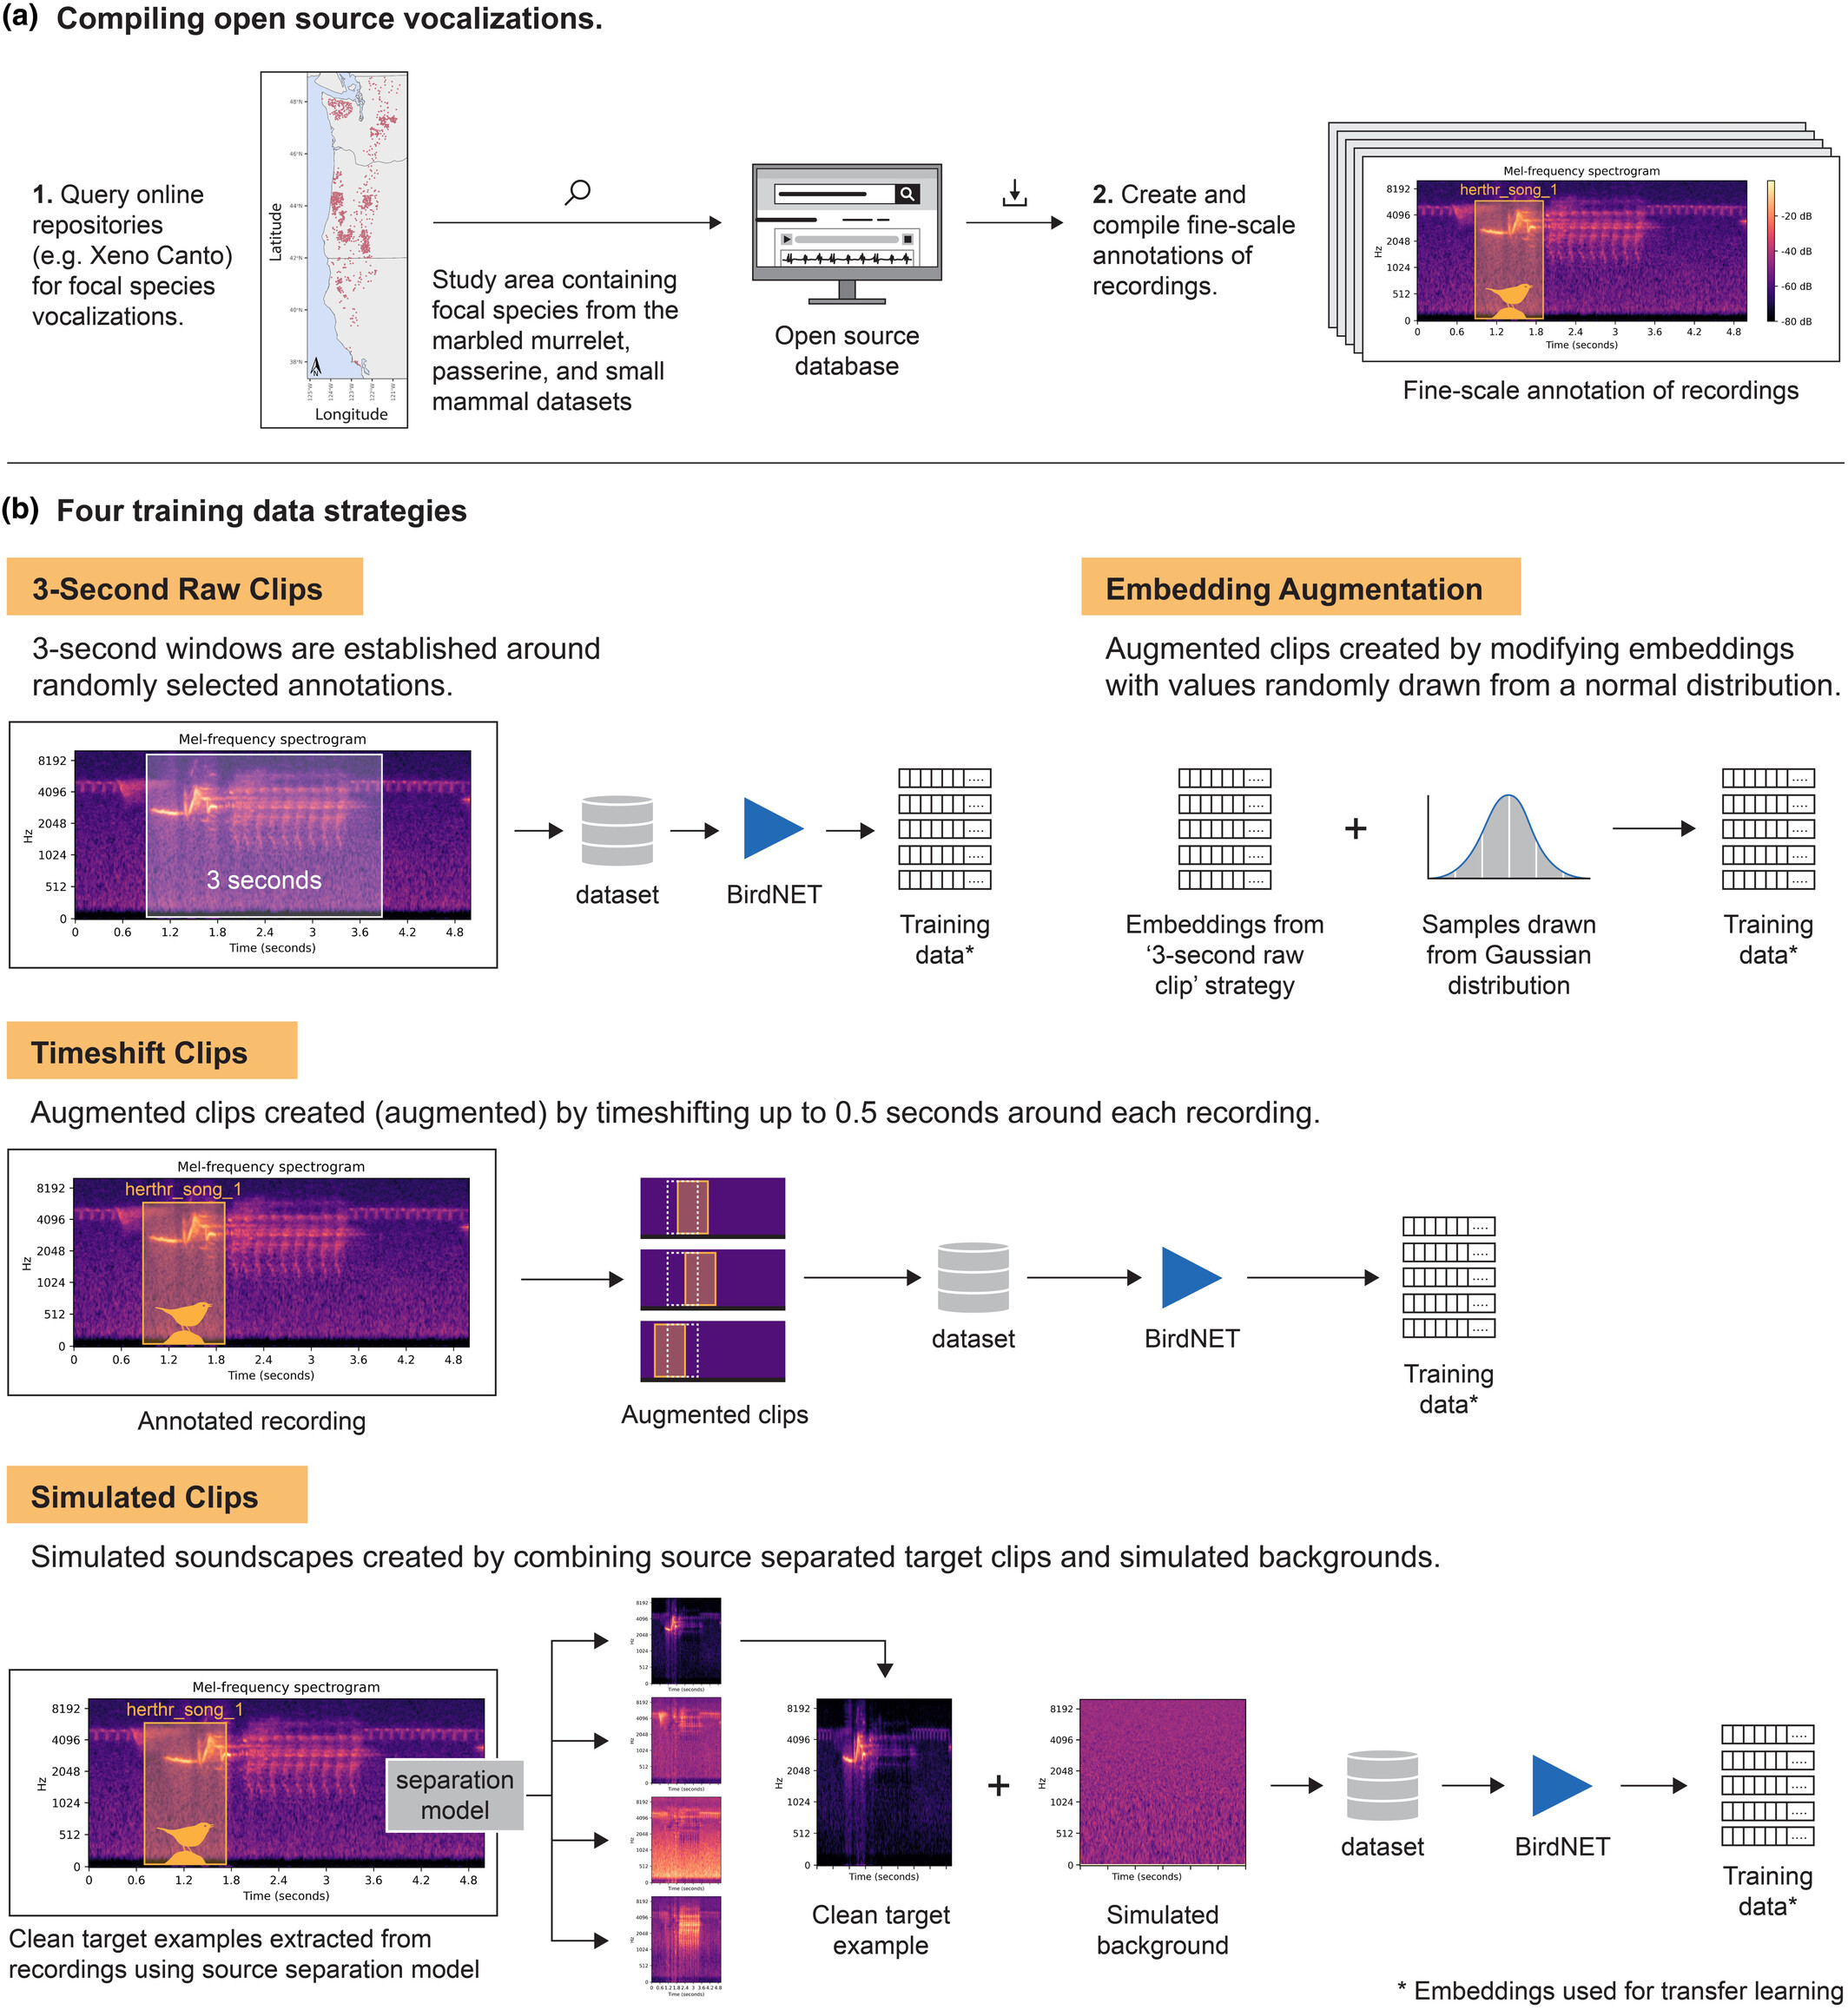
Papers & Reports Simulated soundscapes and transfer learning boost the performance of acoustic classifiers under data scarcity
Authors: Matthew J Weldy; Damon B Lesmeister; Tom Denton; Adam Duarte; Ben J Vernasco; Amandine Gasc; Jennifer C Rowe; Michael J Adams; Matthew G Betts
Date: 2025-06-26 | Outlet: Methods in Ecology and Evolution
The biodiversity crisis necessitates spatially extensive methods to monitor multiple taxonomic groups for evidence of change in response to evolving environmental conditions. Programs that combine passive acoustic monitoring and machine learning are increasingly used to meet this need. These methods require large, annotated datasets, which are time-consuming and expensive to produce, creating potential barriers to adoption in data- and funding-poor regions. Recently released pre-trained avian acoustic classification models provide opportunities to reduce the need for manual labelling and accelerate the development of new acoustic classification algorithms through transfer learning. Transfer learning is a strategy for developing algorithms under data scarcity that uses pre-trained models from related tasks to adapt to new tasks.
Our primary objective was to develop a transfer learning strategy using the feature embeddings of a pre-trained avian classification model to train custom acoustic classification models in data-scarce contexts. We used three annotated avian acoustic datasets to test whether transfer learning and soundscape simulation-based data augmentation could substantially reduce the annotated training data necessary to develop performant custom acoustic classifiers. We also conducted a sensitivity analysis for hyperparameter choice and model architecture. We then assessed the generalizability of our strategy to increasingly novel non-avian classification tasks.
With as few as two training examples per class, our soundscape simulation data augmentation approach consistently yielded new classifiers with improved performance relative to the pre-trained classification model and transfer learning classifiers trained with other augmentation approaches. Performance increases were evident for three avian test datasets, including single-class and multi-label contexts. We observed that the relative performance among our data augmentation approaches varied for the avian datasets and nearly converged for one dataset when we included more training examples.
We demonstrate an efficient approach to developing new acoustic classifiers leveraging open-source sound repositories and pre-trained networks to reduce manual labelling. With very few examples, our soundscape simulation approach to data augmentation yielded classifiers with performance equivalent to those trained with many more examples, showing it is possible to reduce manual labelling while still achieving high-performance classifiers and, in turn, expanding the potential for passive acoustic monitoring to address rising biodiversity monitoring needs.
View All Data Releases on Quantitative Developments
* USGS neither sponsors nor endorses non-USGS web sites; per requirement "3.4.1 Prohibition of Commercial Endorsement."
* PDF documents require Adobe Reader or Google Chrome Browser for viewing.
* PDF documents require Adobe Reader or Google Chrome Browser for viewing.