Advanced Tools for Acoustic Sampling of Calling Amphibians
Imagine sitting at your computer and listening to amphibians that called at a remote wetland late in the evening when no humans were present. Curious, you then decide to listen to amphibians that called at the same time on the same date at many other wetlands in different geographic regions and later analyze all the sounds amphibians, birds, and other sources produced at each wetland to visualize and compare the soundscapes in more detail. The information at your fingertips would be rich far beyond anything available to you previously. Due in part to the ongoing efforts of ARMI scientists, these imagined capabilities are now real and our ability to assess the population statuses of amphibians that call has improved dramatically.
Ecologists long have imagined how advanced digital sound recorders and analytical software could improve amphibian research and conservation. First and foremost, perhaps, such tools would provide an unprecedented ability to collect more comprehensive data on calling activity and dynamics. These tools also would help reduce or eliminate limitations associated with commonly employed human surveys of calling amphibians. These limitations often include: insufficient numbers of surveyed sites or repeat surveys to accurately reflect the presence of target species or to satisfy statistical requirements; variable, but typically undocumented, errors among surveyors in identifying sounds; non-standardized sampling methods of insufficient rigor to promote comparative surveys across large spatial scales or permit straightforward integration with data collected via satellite and other ground-based sensors; and a complete lack of archived sounds from survey sites. Only recently have cost-effective, sophisticated, digital acoustic recorders necessary to record autonomously, and frequently, during extended field deployments become available commercially. And, very importantly, software required to meaningfully analyze voluminous quantities of digital call data has been developed.
Since 2005, scientists from ARMI’s Midwest Region (ARMI-MR) have worked specifically to facilitate improvements in the development and availability of cost-effective acoustic recorders and new analytical software. We needed these tools to enable us to build partnerships and leverage resources to study amphibian populations in ways and places we could not do alone. These are key ARMI objectives to help meet regional and national goals. The recent availability of improved acoustic recorders and analytical software has proven to be the cornerstone of our region’s success in leading the development and implementation of a growing network of partners and research sites. This network is focused on assessing the statuses of amphibian populations relative to global change and related variables along environmental gradients in the United States and Canada ( https://www.umesc.usgs.gov/twgcrn.html ). Since we implemented our first network field sites in 2008, our results from using improved recorders and analytical software clearly have demonstrated their value for surveying and monitoring populations of calling amphibians.
To briefly illustrate some of these results, first listen to this five-minute recording we made at a wetland in the St. Croix National Scenic Riverway in Minnesota at 11 p.m. on June 7, 2008:
![]() SC4DBI108008_20080607_230000.mp3
SC4DBI108008_20080607_230000.mp3
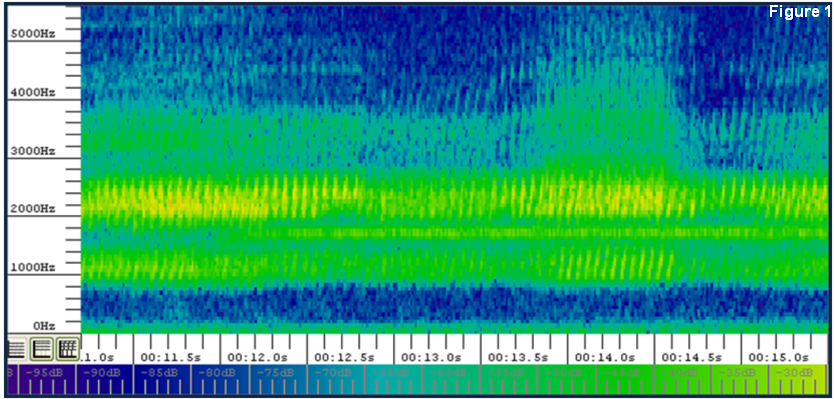
The sounds are dominated by calls from eastern gray treefrogs (Hyla versicolor), with less frequent calls of Cope’s gray treefrogs (H. chrysoscelis) and American toads (Bufo americanus). Figure 1 shows the spectrogram from 0 minutes-11 seconds to 0 minutes-15 seconds of this recording. The calls of eastern gray treefrogs and an American toad are evident in the swath of green and yellow colors spanning approximately 800-4000 Hz on the left axis. The thin band of green color spanning approximately 1600-1800 Hz that first is visible about 12 seconds into the recording is the call of an American toad. The remainder of the sounds represented here are treefrogs. Note that within the broader frequency range of treefrog sounds, the greatest sound intensity (yellow) spanned approximately 2000-2500 Hz and the next most-intense band spanned approximately 800-1400 Hz.
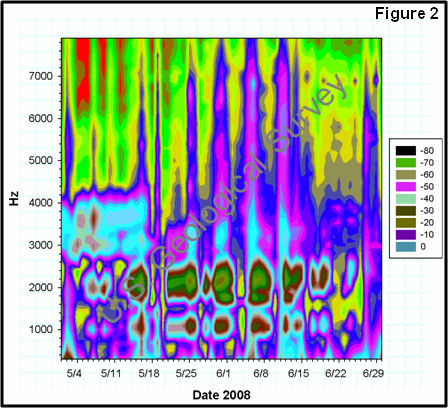
Because we scheduled this recorder to record automatically for five minutes at the top of every hour from early April through early August, we can use a contour plot to examine the frog and toad calls on June 7th within the context of all or a portion of the typical calling season for these species at this site (Figure 2). The colors in this plot indicate relative decibel levels (0 highest, -87 lowest) of sound recorded across frequencies from May 1st through June 30th of 2008. This view illustrates that the calls recorded at 11 p.m. on June 7th occurred on one of the peak calling dates for gray treefrogs and American toads at this site in 2008. It also shows when other peaks occurred. Similarly, one can interpret decibel levels in other unique frequency ranges in terms of sound events for birds, insects, humans, and other sources to characterize the entire soundscape at and near this wetland.
Thus, this relatively simple example demonstrates that we can program digital recorders to record autonomously at regular times in remote locations over an entire season and obtain remarkable recordings of calling amphibians and other sounds. We also can use sophisticated analytical and graphics software to listen to recordings and analyze them to determine if and when amphibians were calling. Using such an integrated acoustic analysis, we can measure species presence and model occupancy over time, compare data with measurements from other sensors to compare calling activity, presence, and occupancy with environmental conditions at different scales, and retain the recordings as part of rich acoustic archives for a site that can be revisited at will. These are remarkable advances in our ability to assess the statuses of populations of calling amphibians at local, regional, and broader scales over time.