Search ARMI Database
Search term(s)
Contribution Number
Search Results
73 record(s) found.
Data Release Chorus Frog (Pseudacris maculata) survey data Cameron Pass Colorado 1986-2025.
Authors: Erin Muths; Amy Wray
Date: 2025-06 | Outlet: Figshare
Capture-recapture survey data for chorus frogs (Pseudacris maculata) at two locations in northern Colorado, USA (Arapahoe-Roosevelt National Forest). Data include capture dates and environmental covariates (air and water temps and wind/cloud cover). There are also limited data on frog color, sex, and measurements (snout-vent length and mass). Data were collected as part of the U.S. Geological Survey (USGS) Amphibian Research and Monitoring Initiative, to contribute to an understanding of demography and population dynamics in small hylid frogs.
Data Release Amphibian nighttime call data from Midwest ARMI cricket frog surveys 2024
Authors: Mark F Roth; Aubrey A Schwonek; Jason Tendler; Ryan C Burner
Date: 2025-05-13 | Outlet: U.S. Geological Survey data release
Amphibian nighttime call data from Midwest ARMI surveys conducted in 2024 in Minnesota, Wisconsin, Iowa, Illinois. Many of the surveys were targeting potential Blanchard's cricket frog (Acris blanchardi) habitat.
Data Release Amphibian nighttime call data from Midwest ARMI surveys 2003-2008
Authors: Mark F Roth; Ryan C Burner; Walt J Sadinski
Date: 2025-05-13 | Outlet: U.S. Geological Survey data release
Amphibian nighttime call data from Midwest ARMI surveys conducted in 2003-2008 in Minnesota, Wisconsin, Iowa, Illinois. Many of the surveys were targeting potential Blanchard's cricket frog (Acris blanchardi) habitat
Data Release Amphibian (chorus frog, wood frog, tiger salamander) surveys in Rocky Mountain National Park (1986-2022)
Authors: Amanda M Kissel; Erin Muths
Date: 2023-01-24 | Outlet: sciencebase
This data release contains information collected during surveys for chorus fogs (Pseudacris maculata), wood frogs (Lithobates sylvaticus) and tiger salamanders (Ambystoma mavortium) conducted in Rocky Mountain National Park (1986 – 2022) by the U.S. Geological Survey. Survey methods included visual encounter and aural surveys, and dip netting. Data collected between 1986 and 1994 focused on named water bodies in Rocky Mountain National Park. Data collected between 1995 and 1999 are from focal monitoring sites as well as sporadic surveys of other wetlands. Data collected between 2000-2002 represent repeated surveys conducted between 1986 and 1994 (e.g., park-wide surveys of named water bodies) and additional surveys of unnamed waterbodies. Data collected after 2002 were collected under an occupancy framework. Sites were identified within pre-defined catchments using the National Wetlands Inventory Database to locate potential amphibian breeding habitat (e.g., ponds, ephemeral wetlands). If appropriate sites were encountered in the field and were not indicated on National Wetland Inventory databases (https://www.fws.gov/program/national-wetlands-inventory/metadata), they were added as incidental sites. Waterbodies were visited and surveyed at least two times during the amphibian active season (May and mid-August). Water bodies were surveyed for all life stages of amphibians.
Data Release Mercury concentrations in amphibian tissues across the United States, 2016-2021
Authors: Colleen S Emery; Collin A Eagles-Smith; Kelly L Smalling; Blake R Hossack; Brian J Tornabene; Michael J Adams; Adam R Backlin; Adrianne B Brand; Robert N Fisher; Jill Fleming; Brad M Glorioso; Daniel A Grear; Evan HC Grant; Brian J Halstead; Patrick M Kleeman; David AW Miller; Erin Muths; Christopher A Pearl; Jennifer C Rowe; Caitlin T Rumrill; Hardin J Waddle; Megan E Winzeler
Date: 2023-08-23
Comma-separated values (.csv) file containing data related to amphibian sampling across the United States between 2016 and 2021. Data files contain mercury concentrations in amphibian and dragonfly tissues, mercury concentrations in sediment, as well as amphibian morphometrics, and habitat and climate characteristics where the samples were collected.
Data Release Student Network for Amphibian Pathogen Surveillance Data: U.S. Geological Survey data release
Authors: Megan E Winzeler; Daniel A Grear
Date: 2023-05-16 | Outlet: USGS Science Base
Data in this dataset were collected as a part of the Student Network for Amphibian Pathogen Surveilance (SNAPs) program throughout the United States by undergraduate students in biology or ecology courses as a part of their curriculum throughout 2022. This data was collected in the field by students and sent to the USGS National Wildlife Health Center (NWHC) for testing of two amphibian fungal pathogens, Batrachochytrium dendrobatidis (Bd) and Batrachochytrium salamandrivorans (Bs). The dataset includes both the field records of the individual amphibians tested and the results for individuals for Bd and Bsal
Data Release Student Network for Amphibian Pathogen Surveillance Data: U.S. Geological Survey data release
Authors: Megan E Winzeler; Daniel A Grear
Date: 2023-05-08 | Outlet: USGS Science Base
Data release of Bd and Bsal detection results from the ARMI funded Student Network for Amphibian Pathogen Surveillance network. Includes 40+ institutions from the U.S. and Mexico as of calendar year 2022
Data Release Data from an annual trapping effort of an urban aquatic turtle population in Lafayette, Louisiana from 2009–2021
Authors: Brad M Glorioso
Date: 2022-09-27
Data Release Long-term effects of timber harvest on vernal pool availability and occupancy of two obligate amphibians: U.S. Geological Survey data release
Authors: Evan HC Grant; Adrianne B Brand
Date: 2023-05-23 | Outlet: ScienceBase
This data set is comprised of 3 files of information collected on amphibians and vernal pool habitats at Canaan Valley National Wildlife Refuge from 2004 - 2016.
Data Release Data release - Abiotic and biotic factors reduce viability of a high-elevation salamander in its native range
Authors: Evan HC Grant; Graziella V DiRenzo; Adrianne B Brand
Date: 2023-04-11 | Outlet: ScienceBase
Includes data used to estimate population demographic parameters for an exemplary high-elevation amphibian species, the federally endangered Shenandoah salamander (Plethodon shenandoah). These parameters were entered into a Markov projection model which we used to forecast the future population status of the Shenandoah salamander.
Data Release Student Network for Amphibian Pathogen Surveillance Data: U.S. Geological Survey data release
Authors: Megan E Winzeler; Daniel A Grear
Date: 2023-05-08 | Outlet: USGS Science Base
Data in this dataset were collected as a part of the Student Network for Amphibian Pathogen Surveilance (SNAPs) program throughout the United States by undergraduate students in biology or ecology courses as a part of their curriculum2020-2022. This data was collected in the field by students and sent to the USGS National Wildlife Health Center (NWHC) for testing of two amphibian fungal pathogens, Batrachochytrium dendrobatidis (Bd) and Batrachochytrium salamandrivorans (Bsal).
Data Release Cascade torrent salamander (Rhyacotriton cascadae) surveys in Oregon and Washington 2022
Authors: Jennifer C Rowe; Christopher A Pearl; Brome McCreary; Meredith S Diskin; Chelsea Waddell; Michael J Adams
Date: 2023-04-04
We conducted visual surveys for (Rhyacotriton cascadae at 65 sites in Oregon and Washington that were historically occupied by the species to evaluate it's status across it's range and determine whether the species merits listing under the Endangered Species Act. This dataset includes counts of all amphibians observed during each site survey, as well as habitat and water sampling covariates between 4 May and 12 October of 2022.
Data Release Oregon spotted frog (Rana pretiosa) telemetry and habitat use at Crane Prairie Reservoir in Oregon, USA
Authors: Christopher A Pearl; Jennifer C Rowe; Brome McCreary; Michael J Adams
Date: 2022-04-06
We used radio-telemetry to study late-season movement and habitat use by Oregon spotted frogs (Rana pretiosa) at Crane Prairie Reservoir in Oregon. This dataset includes individual frog location data and habitat use during each tracking event that occurred roughly weekly between September and late November of 2018.
Data Release Calculations of BioLake climate data
Authors: Ryan C Burner; Richard E Erickson
Date: 2022-11-01 | Outlet: USGS GitLab
Climate data allow people to examine species distributions and possible distributions. This script takes ERA5-Land climate estimates (https://www.ecmwf.int/en/forecasts/datasets/reanalysis-datasets/era5) for precipitation and lake temperature and processes them to create summary climate layers for use with biological organisms in lakes. This code could be modified to use a different subset of years.
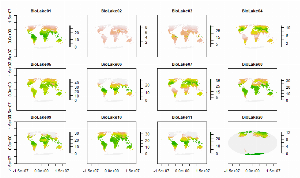
These BioLake raster data provide global estimates (~10.0 x 12.4 km resolution) of twelve bioclimatic variables based on estimated lake temperature. Eleven of these twelve variables (BioLake01 - BioLake11) are estimated for each of three lake strata: lake mix (surface) layer, lake bottom, and total lake water column. These eleven variables correspond to CHELSA (Climatologies at high resolution for the earth's land surface areas) bioclimatic variables BIO1 - BIO11, except that these BioLake variables are based on lake water temperature and CHELSA BIO1 - BIO11 variables are based on air temperature. CHELSA BIO is also calculated a finer spatial resolution (~1 x 1 km). The twelfth variable (BioLake20; months with non-zero ice cover) does not correspond to any CHELSA bioclimatic variable. The data are supplied as a multi-layer raster (.grd) file in the World Mollweide projection, accompanied by a header file (.gri) with layer names.
For BioLake layer download, see https://doi.org/10.5066/P96QLN5Y
Data Release BioLake bioclimatic variables based on ERA5-Land lake temperature estimates 1991-2020
Authors: Ryan C Burner; Richard E Erickson
Date: 2022-01-21 | Outlet: USGS ScienceBase
These BioLake raster data provide global estimates (~10.0 x 12.4 km resolution) of twelve bioclimatic variables based on estimated lake temperature. Eleven of these twelve variables (BioLake01 - BioLake11) are estimated for each of three lake strata: lake mix (surface) layer, lake bottom, and total lake water column. These eleven variables correspond to CHELSA (Climatologies at high resolution for the earth's land surface areas) bioclimatic variables BIO1 - BIO11, except that these BioLake variables are based on lake water temperature and CHELSA BIO1 - BIO11 variables are based on air temperature. CHELSA BIO is also calculated a finer spatial resolution (~1 x 1 km). The twelfth variable (BioLake20; months with non-zero ice cover) does not correspond to any CHELSA bioclimatic variable. The data are supplied as a multi-layer raster (.grd) file in the World Mollweide projection, accompanied by a header file (.gri) with layer names.
Data Release Water level data from select depressional wetlands at Saint Marks National Wildlife Refuge: July 2010 - May 2019 (ver. 2.0, August 2022)
Authors: Jeffrey W Riley
Date: 2022-08-08 | Outlet: ScienceBase
This Data Release represents geospatial and tabular data for a study investigating linkages between local terrain and wetland hydroperiod and was supported by the U.S. Geological Survey (USGS) Amphibian Research and Monitoring Initiative (ARMI). This dataset contains wetland water level data from Saint Marks National Wildlife Refuge (SMNWR). Data include records of water level and water temperature measurements from select wetlands beginning in July 2010 and ending in 2019. Not all wetlands span this entire period as different phases of studies resulted in different time periods of data collection. Instrumentation included a staff gage and a non-vented continuous logging pressure transducer that logged data at 1-hour intervals. The dataset consists of 4 separate items:
1. water level monitoring site Locations (tabular data)
2. wetland perimeters (GIS vector data)
3. water level and water temperature data for 59 select wetlands (tabular data)
4. revision history text file that describes the changes from the original release to version 2.0.
1. water level monitoring site Locations (tabular data)
2. wetland perimeters (GIS vector data)
3. water level and water temperature data for 59 select wetlands (tabular data)
4. revision history text file that describes the changes from the original release to version 2.0.
Data Release Vernal pool inundation models
Authors: Jennifer M Cartwright; TL Morelli; Evan HC Grant
Date: 2020-06
This website provides an application for exploring modeling results from a U.S. Geological Survey (USGS) project titled Mapping Climate Change Resistant Vernal Pools in the Northeastern U.S. The purpose of this project was to improve understanding of the factors that control inundation patterns in vernal pools of the northeastern United States, so as to identify pools that might function as hydrologic refugia under climate change.
Data Release Capture-mark-recapture data for Oregon spotted frogs [Rana pretiosa] along the Deschutes River, Oregon, 2016-2019
Authors: Jennifer C Rowe; Adam Duarte; Christopher A Pearl; Brome McCreary; P K Haggerty; Michael J Adams
Date: 2021-06-04 | Outlet: Ecosphere, v. 12, no. 6, p. e03634
Altered flow regimes can contribute to dissociation between life history strategies and environmental conditions, leading to reduced persistence reported for many wildlife populations inhabiting regulated rivers. The Oregon spotted frog Rana pretiosa is a threatened species occurring in floodplains, ponds, and wetlands in the Pacific Northwest with a core range in Oregon, USA. All life stages of R. pretiosa are reliant on aquatic habitats, and inundation patterns across the phenological timeline can have implications for population success. We conducted capture–mark–recapture (CMR) sampling of adult and subadult R. pretiosa at three sites along the Deschutes River downstream from two dams that regulate flows. We related the seasonal extent of inundated habitat at each site to monthly survival probabilities using a robust design CMR model. We also developed matrix projection models to simulate population dynamics into the future under current river flows. Monthly survival was strongly associated with the extent and variability of inundated habitat, suggesting some within-season fluctuations at higher water levels could be beneficial. Seasonal survival was lowest in the winter for all three sites, owing to limited water availability and the greater number of months within this season relative to other seasons. Population growth for the two river-connected sites was most strongly linked to adult survival, whereas population growth at the river-disconnected site was most strongly tied to survival in juvenile stages. This research identifies population effects of seasonally limited water and highlights conservation potential of enhancing survival of particularly influential life stages.
Data Release Report to NECSC: Adaptive capacity in a forest indicator species
Authors: Evan HC Grant; David AW Miller; David J Muñoz; S C Sterrett; Adrianne B Brand; T D Dubreiul; M O'Donnell; R Schilder
Outlet: ScienceBase
Data contain metabolic rates of red-backed salamanders (Plethodon cinereus) exposed to different thermal regimes, and the movements of salamanders marked with PIT tags and exposed to electromagnetic fields.
Data Release Hydrological measurements of 300 US temporary wetlands from 2004-2014
Authors: Courtney L Davis; David AW Miller; Evan HC Grant; Brian J Halstead; Patrick M Kleeman; Susan C Walls; William J Barichivich
Date: 2018 | Outlet: ScienceBase
This dataset includes hydrological measurements of 300 US temporary wetlands from 2004-2014.


