Search ARMI Database
Search term(s)
Contribution Number
Search Results
880 record(s) found.
Papers & Reports Spatial capture-recapture reveals age- and sex-specific survival and movement in stream amphibians
Authors: R K Honeycutt; Justin Garwood; W H Lowe; Blake R Hossack
Date: 2019 | Outlet: Oecologia 19:821-833
Life history information sets the foundation for our understanding of ecology and conservation requirements. For many species, this information is lacking even for basic demographic rates such as survival and movement. When survival and movement estimates are available, they are often derived from mixed demographic groups and do not consider differences among life stages or sexes, which is critical because life stages and sexes often contribute differentially to population dynamics. We used hierarchical models informed with spatial capture-mark-recapture data of Ascaphus montanus (Rocky Mountain tailed frog) in 5 streams and A. truei (coastal tailed frog) in 1 stream to estimate variation in survival and movement by sex and age, represented by size. By incorporating survival and movement into a single model, we were able to estimate both parameters with limited bias. Annual survival was similar between sexes of A. montanus (females = https://0.885 [95% CI: 0.614?1], males = https://0.901 [0.657?1]), but was slightly higher for female A. truei (https://0.836 [0.560?0.993]) than for males (https://0.664 [0.354?0.962]). Survival of A. montanus peaked at mid-age, suggesting that lower survival of young and actuarial senescence may influence population demographics. Our models suggest that younger A. montanus moved farther than older individuals, and that females moved farther than males in both species. Our results provide uncommon insight into age- and sex-specific rates of survival and movement that are crucial elements of life-history strategies and are important for modeling population growth and prescribing conservation actions.
Papers & Reports Proactive management of amphibians: challenges and opportunities
Authors: S C Sterrett; R A Katz; Adrianne B Brand; W R Fields; A Dietrich; D J Hocking; T M Foreman; A N Wiewel; Evan HC Grant
Date: 2019-08 | Outlet: Biological Conservation
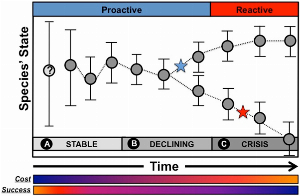
Delaying species management reduces the chance of successful recovery, increases the risk of extinction, and can be expensive. Acting before major declines are realized affords access to a greater suite of cost-effective management actions to sustain populations, reducing the likelihood of declines warranting protected status. It is clear that reactive management approaches are not sufficient for amphibian conservation and a successful path forward will require proactive approaches. We describe how conservation timelines and structured decision making can help evaluate management options available to species given current, and often limited, knowledge about populations or distributions. We illustrate this framework by highlighting management of common and widespread amphibians, as many species are in decline, including those found in protected conservation areas. We promote the development of explicit management objectives, management triggers and advocate for evaluating the cost-effectiveness of actions before species declines are observed.
Papers & Reports Identifying common decision problem elements for the management of emerging fungal diseases of wildlife
Authors: Riley F Bernard; Evan HC Grant
Date: 2019-05-11 | Outlet: Society and Natural Resources
Emerging infectious diseases (EIDs) of wildlife have characteristics that make them difficult to manage, leading to reactive and often ineffective management strategies. Currently, two fungal pathogens, Pseudogymnoascus destructans (Pd) and Batrachochytrium salamandrivorans (Bsal), are causing declines in novel host species. To improve the application of management strategies to address the risk of these pathogens to North American wildlife, we queried wildlife managers about their concerns regarding managing populations of bats and amphibians potentially impacted by Pd and Bsal. Using these responses, we identified aspects of each decision problem that were shared across pathogens, regions and agencies ? and found similarities in decision problem elements for disease management. Reframing management problems as decisions can enable managers to identify similarities across EIDs, i.e. uncertainties within management actions, and improve reactive responses if proactive management is not possible. Such an approach recognizes context-specific constraints and identifies relevant uncertainties that must be reduced in developing a response.
Papers & Reports Survival cost to relocation does not reduce population self-sustainability in an amphibian
Authors: Hugo Cayuela; L Gillet; A Laudelout; Aurélien Besnard; Eric Bonnaire; Pauline Levionnois; Erin Muths; M Dufrene; T Kinet
Date: 2019-05 | Outlet: Journal of Applied Ecology
Relocations are increasingly popular among wildlife managers despite often low rates of relocation success in vertebrates. In this context, understanding the influence of extrinsic (e.g., relocation design, habitat characteristics) and intrinsic factors (e.g., age and sex) on demographic parameters, such as survival, that regulate the dynamics of relocated populations is critical to improve relocation protocols and better predict relocation success. We investigated survival rates in naturally established and relocated populations of yellow-bellied toads (Bombina variegata), an amphibian that was nearly extinct in Belgium by the late 1980s. We quantified survival at three ontogenetic stages (juvenile, subadult, and adult) in the relocated population, the source population, and a control population. In the relocated population, we quantified survival in captive bred individuals and their locally born descendants. Then, using simulations, we examined how survival cost to relocation affects the self-sustainability of the relocated population. We showed that survival at juvenile and subadult stages was relatively similar in all populations. In contrast, relocated adult survival was lower than adult survival in the source and control populations. Despite this, offspring of relocated animals (the next generation, regardless of life stage) survived at similar rates to individuals in the source and control populations. Simulations revealed that the relocated population was self-sustaining under different scenarios and that the fate (e.g., stability or increase) of the simulated populations was highly dependent on the fecundity of relocated adults and their offspring. our results indicate that survival in relocated individuals is lower than in non-relocated individuals but that this cost (i.e., reduced survival) disappears in the second generation. A finer understanding of how relocation affects demographic processes is an important step in improving relocation success of amphibians and other animals.
Papers & Reports Seeking shelter from the storm: Conservation and management of imperiled species in a changing climate.
Authors: Susan C Walls; William J Barichivich; J Chandler; A M Meade; M Milinichik; Katherine M O'Donnell; M E Owens; Terry Peacock; Joseph Reinman; O E Wetsch
Date: 2019-05-30 | Outlet: Ecology and Evolution 9(12): 7122-7133.
Climate change is anticipated to exacerbate the extinction risk of species whose persistence is already compromised by habitat loss, invasive species, disease, and other stressors. In coastal areas of the southeastern United States, many imperiled vertebrates are vulnerable to hurricanes, which climate models predict to become more severe in the 21st century. Despite this escalating threat, explicit adaptation strategies that address hurricane threats, in particular, and climate change more generally, are largely underrepresented in recovery planning and implementation. Our purpose herein is to provide a basis for stronger emphasis on strategic planning for imperiled species facing the increasing threat of catastrophic hurricanes. Our reasoning comes from observations of short-term environmental and biological impacts of Hurricane Michael, which impacted the Gulf Coast of the southeastern USA in October 2018. During this storm, St. Marks National Wildlife Refuge, located along the northern Gulf of Mexico's coast in the panhandle region of Florida, experienced storm surge that was 2.3 to 3.3 m above sea level. Storm surge pushed sea water into some ephemeral freshwater ponds used for breeding by the federally-threatened Frosted Flatwoods Salamander (Ambystoma cingulatum). After the storm, specific conductance across all ponds varied from 80 to 23,100 ?S/cm, compared to 75 to 445 uS/cm in Spring 2018. For those overwashed wetlands that were measured in both Spring and Fall 2018, post-hurricane conductance observations averaged nearly 100 times greater than in the previous Spring, setting the stage for varying population responses across this coastal landscape. Importantly, we found live individual flatwoods salamanders at both overwashed and non-overwashed sites, although we cannot yet assess the demographic consequences of this storm. We outline actions that could be incorporated into climate adaptation strategies and recovery planning for imperiled species, like A. cingulatum, that are associated with freshwater coastal wetlands in hurricane-prone regions.
Papers & Reports Salamander chytrid fungus risk assessment on Department of Defense Installations.
Authors: C Petersen; Katherine LD Richgels; G Lockhart; Robert E Lovich
Date: 2018-12-01 | Outlet: Department of Defense Legacy Resource Management Program
The United States Department of Defense Partners in Amphibian and Reptile Conservation (DoD PARC) network and the U.S. Geological Survey (USGS) National Wildlife Health Center developed this report to serve as an informational tool to assess which U.S. military installations may be at risk to Bsal introduction, improve the potential response to an outbreak, and help prioritize relevant actions on their respective installations if this fungal pathogen were to be introduced into the U.S. Since 2015, DoD PARC has been directly involved in identifying research, monitoring, and management strategies for Bsal (Grant et al. 2015). The military installations included in this assessment were those documented to have confirmed presence of salamander species as determined by a 2017 inventory of herpetofauna of military lands
Papers & Reports Knowing your limits: estimating range boundaries and co-occurrence zones for two competing plethodontid salamanders
Authors: Staci M Amburgey; David AW Miller; Adrianne B Brand; A Dietrich; G ra Campbell
Date: 2019 | Outlet: Ecosphere
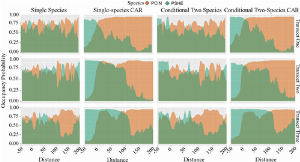
Understanding threats to species persistence requires knowledge of where species currently occur. We explore methods for estimating two important facets of species distributions, namely where the range limit occurs and how species interactions structure distributions. Accurate understanding of range limits is crucial for predicting range dynamics and shifts in response to interspecific interactions and climate change. Additionally, species interactions are increasingly recognized as an important but not well understood predictor of range shifts. Our objective was to predict range limits and contact zones for two plethodontid salamanders, the highly range restricted Shenandoah salamander (Plethodon shenandoah) and the wide-ranging red-backed salamander (Plethodon cinereus ). Using detection/non-detection data, we assess four methodological decisions when estimating species’ distributions: 1) accounting for imperfect detection, 2) covariates to predict species occurrences, 3) accounting for species interactions, and 4) the inclusion of spatial autocorrelation. We found that Shenandoah salamander and red-backed salamander co-occurrence would have been underestimated and the range edge misidentified had we not accounted for incomplete detection. Covariates related to habitat were not sufficient to explain species’ range boundaries. Models that included spatial autocorrelation (i.e., a conditional autoregressive random effect) performed better than models that included just species interactions (i.e., detection and occurrence were conditional on the other species being present) and models that included both spatial autocorrelation and species interactions. Further, we found that the breadth of primary contact zones was typically 60 to 170 m, which is greater on average than previous estimates. In addition, we frequently observed secondary, disjunct contact zones along the range boundary. Understanding the extent to which species co-occur and how the range boundaries are shaped is crucial to conservation efforts. Our work indicates that accounting for detection is crucial for accurately characterizing range edges and that spatial models may be especially effective in modeling distributions at the boundary.
Papers & Reports Persistent salinization of surface and groundwater resources from legacy energy development in the Prairie Pothole Region
Authors: Todd Preston; Chauncey W Anderson; J N Thamke; Blake R Hossack; K J Skalak; I M Cozzarelli,
Outlet: Science of the Total Environment 690:522-533
Papers & Reports Amphibian conservation in the Anthropocene
Authors: Evan HC Grant; Erin Muths; Benedikt R Schmidt; S Petrovan
Date: 2019-08 | Outlet: Biological Conservation 236 (2019) 543–547
Research is necessary to identify patterns in nature, to understand how a system functions, and to make predictions about the future state of an ecosystem. Applied research in conservation biology can identify effective strategies to maintain biodiversity, though many papers end with the conclusion that more research is needed. However, more research does not necessarily lead to solutions. We use the ongoing global decline of amphibians as a salient example to highlight limitations in current conservation research, and to focus on finding solutions which are directly relevant for conservation. While research has been conducted since declines were first detected in the 1990s, outside a few specific examples, little progress in conservation has been achieved. We suggest that the case of amphibian declines is relevant to conservation science in general, as the current paradigm for conservation is that management is planned after research is completed; research and management are not effectively (and not directly) connected. This disconnect illustrates the knowledge-action divide which has been noted recently as a serious deficiency in conservation. Accordingly, we use this introductory paper to the Special Issue (Amphibian conservation in the Anthropocene: Progress and challenges) to describe amphibians as a conservation dilemma, and to make the case for a different, more pragmatic, and more solutions-focused, view of conservation research.
Papers & Reports North-facing slopes and elevation shape asymmetric genetic structure in the range-restricted salamander Plethodon shenandoah
Authors: K P Mulder; N Cortes-Rodriguez; Evan HC Grant; Adrianne B Brand; R C Fleischer
Date: 2019-04-16 | Outlet: Ecology and Evolution
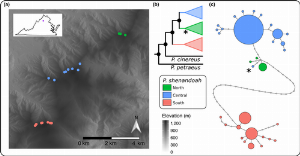
Species with narrow environmental preferences are often distributed across fragmented patches of suitable habitat, and dispersal among subpopulations can be difficult to directly observe. Genetic data collected at population centers can help quantify gene flow, which is especially important for vulnerable species with a disjunct range. Plethodon shenandoah is a Federally Endangered salamander known only from three mountaintops in Virginia, USA. To reconstruct the evolutionary history and population connectivity of this species, we generated both mitochondrial and nuclear data using sequence capture for all three populations and found strong population structure that was independent of geographic distance. Both the nuclear markers and mitochondrial genome indicated a deep split between the most southern population and the combined central and northern population. Although there was some mitochondrial haplotype-splitting between the central and northern populations, there was complete admixture in nuclear markers. This is indicative of either a recent split or current male-biased dispersal among mountain isolates. Models of landscape resistance found that dispersal across north-facing slopes at mid-elevation levels best explain the observed genetic structure among populations. These unexpected results highlight the importance of landscape features in understanding and predicting movement and fragmentation of salamanders across space.
Papers & Reports Disentangling effects of invasive species and habitat while accounting for observer error in a long-term amphibian study
Authors: Jennifer C Rowe; Adam Duarte; Christopher A Pearl; Brome McCreary; Stephanie K Galvan; James T Peterson; Michael J Adams
Date: 2019-04-02 | Outlet: Ecosphere
The invasive American bullfrog (Lithobates catesbeianus) and a variety of non-native sport fish commonly co-occur in lowland lentic habitats of the western United States. Both invasive taxa are implicated in declines of native amphibians in this region, but few long-term studies of communities exist. Further, field studies of invasive-native interactions are complicated by confounding habitat modifications and observation errors. We surveyed amphibians and measured habitat characteristics for 12 years across 38 wetland sites within the Willamette Valley, Oregon, USA. We assessed the influence of invasive species, habitat, and their interactions on the distributions of five native amphibian species using a multispecies dynamic occupancy model that accounted for false-negative and false-positive detections. In general, habitat characteristics ? such as within-pond vegetation cover, surrounding forest, and drought severity ? were important for local persistence of native species when bullfrogs co-occurred. We also found evidence of a cumulative negative effect of bullfrogs and non-native fish (families Centrarchidae and Ictaluridae) on northern red-legged frog (Rana aurora) local persistence that was mediated by the dominance of invasive reed canarygrass (Phalaris arundinacea). Non-native fish and bullfrogs had variable effects on native amphibian species, but neither invasive taxa appears to be causing declines in occupied sites within our study area. Moreover, species relationships with habitat differed when invaders were present, indicating that certain habitats may increase persistence of native amphibians in the invaded landscape.
Papers & Reports Functional variation at an expressed MHC class II? locus predicts Ranavirus infection intensity in larval anuran populations
Authors: Anna E Savage; W ol Muletz; Evan HC Grant; R C Fleischer; K P Mulder
Date: 2019 | Outlet: Immunogenetics
Infectious diseases are causing catastrophic losses to global biodiversity. Iridoviruses in the genus Ranavirus are among the leading causes of amphibian disease-related mortality. Polymorphisms in major histocompatibility complex (MHC) genes are significantly associated with variation in amphibian pathogen susceptibility. MHC genes encode two classes of polymorphic cell-surface molecules that can recognize and bind to diverse pathogen peptides. While MHC class I genes are the classic mediators of viral acquired immunity, larval amphibians do not express them. Consequently, MHC class II gene diversity may be an important predictor of Ranavirus susceptibility in larval amphibians, the life stage most susceptible to Ranavirus. We surveyed natural populations of larval wood frogs (Rana sylvatica), which are highly susceptible to Ranavirus, across 17 ponds and two years in Maryland, USA. We sequenced the peptide-binding region of an expressed MHC class II? locus and assessed allelic and genetic diversity. We converted alleles to functional supertypes and determined if supertypes influenced host responses to Ranavirus. Among 384 sampled individuals, 26% were infected with Ranavirus. We recovered 20 unique MHC class II? alleles that fell into two deeply diverged clades and seven supertypes. MHC genotypes were associated with Ranavirus infection intensity, but not prevalence. Specifically, heterozygotes and individuals with genotype ST1/ST7 had significantly lower Ranavirus infection intensity compared to homozygotes and all other genotypes. We conclude that MHC class II? functional genetic variation is an important component of Ranavirus susceptibility. Identifying immunogenetic signatures linked to variation in disease susceptibility can inform mitigation strategies for combatting global amphibian declines.
Papers & Reports Drought-mediated extinction of an arid-land amphibian: insights from a spatially explicit dynamic occupancy model
Authors: E R Zylstra; D E Swann; Blake R Hossack; Erin Muths; R J Steidl
Outlet: Ecological Applications 29: e01859
Understanding how natural and anthropogenic processes affect population dynamics of species with patchy distributions is critical to predicting their responses to environmental changes. Despite considerable evidence that demographic rates and dispersal patterns vary temporally in response to an array of biotic and abiotic processes, few applications of metapopulation theory have sought to explore factors that explain spatio-temporal variation in extinction or colonization rates. To facilitate exploring these factors, we extended a spatially explicit model of metapopulation dynamics to create a framework that requires only binary presence-absence data, makes few assumptions about the dispersal process, and accounts for imperfect detection. We apply this framework to 22 years of biannual survey data for lowland leopard frogs, Lithobates yavapaiensis, an amphibian that inhabits arid stream systems in the southwestern U.S. and northern Mexico. Our results highlight the importance of accounting for factors that govern temporal variation in transition probabilities, as both extinction and colonization rates varied with hydrologic conditions. Specifically, local extinctions were more frequent during drought periods, particularly at sites without reliable surface water. Colonization rates increased when larval and dispersal periods were wetter than normal, which increased the probability that potential emigrants metamorphosed and reached neighboring sites. Extirpation of frogs from one watershed during a period of severe drought demonstrated the influence of site-level features, as frogs persisted only in areas where most sites held water consistently and where the amount of sediment deposited from high-elevation wildfires was low. Application of our model provided novel insights into how climate-related processes affected the distribution and population dynamics of an arid-land amphibian. The approach we describe has application to a wide array of species that inhabit patchy environments, can improve our understanding of factors that govern metapopulation dynamics, and can inform strategies for conservation of imperiled species.
Papers & Reports A hierarchical analysis of habitat area, connectivity, and quality on amphibian diversity across spatial scales
Authors: Alexander D Wright; Evan HC Grant; E F Zipkin
Date: 2020 | Outlet: Landscape Ecology
We developed a multi-region community occupancy model to analyze 13 years (2005–2017) of amphibian monitoring data within the National Capital Region, a network of U.S. National Parks. Our analysis reveals how scale can mediate interpretation of results from scientific studies, which might help explain conflicting narratives concerning the impacts of fragmentation in the literature. Our hierarchical framework can help managers and policymakers elucidate the relevant spatial scale(s) to target conservation efforts.
Papers & Reports Disease structured N-mixture models: A practical guide to model disease dynamics using count data
Authors: Graziella V DiRenzo; C Che-Castaldo,; S Saunders; Evan HC Grant; E F Zipkin
Date: 2018 | Outlet: Ecology and Evolution
1. Obtaining inferences on disease dynamics (e.g., host population size, pathogen prevalence, transmission rate, host survival probability) typically requires marking and tracking individuals over time. While multistate mark?recapture models can produce high-quality inference, these techniques are difficult to employ at large spatial and long temporal scales or in small remnant host populations decimated by virulent pathogens, where low recapture rates may preclude the use of mark?recapture techniques.
2. Recently developed N-mixture models offer a statistical framework for estimating wildlife disease dynamics from count data. N-mixture models are a type of state-space model in which observation error is attributed to failing to detect some individuals when they are present (i.e., false negatives). The analysis approach uses repeated surveys of sites over a period of population closure to estimate detection probability.
3. We review the challenges of modeling disease dynamics and describe how N-mixture models can be used to estimate common metrics, including pathogen prevalence, transmission, and recovery rates while accounting for imperfect host and pathogen detection. We also offer a perspective on future research directions at the intersection of quantitative and disease ecology, including the estimation of false positives in pathogen presence, spatially-explicit disease-structured N-mixture models, and the integration of other data types with count data to inform disease dynamics.
4. Managers rely on accurate and precise estimates of disease dynamics to develop strategies to mitigate pathogen impacts on host populations. At a time when pathogens pose one of the greatest threats to biodiversity, statistical methods that lead to robust inferences on host populations are critically needed for rapid, rather than incremental, assessments of the impacts of emerging infectious diseases.
Papers & Reports The contribution of road-based citizen science efforts to the conservation of pond-breeding amphibians
Authors: S C Sterrett,; R A Katz; W R Fields; Evan HC Grant
Date: 2018-12-24 | Outlet: Journal of Applied Ecology
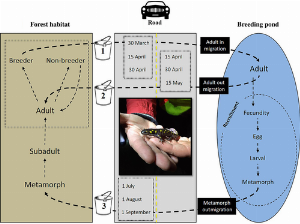
Roadside amphibian citizen science (CS) programmes bring together volunteers focused on collecting scientific data while working to mitigate population declines by reducing road mortality of pond-breeding amphibians. Despite the international popularity of these movement-based, roadside conservation efforts (i.e. “big nights,” “bucket brigades” and “toad patrols”), direct benefits to conservation have rarely been quantified or evaluated. As a case study, we used a population simulation approach to evaluate how volunteer intensity, frequency and distribution influence three conservation outcomes (minimum population size, population growth rate and years to extinction) of the spotted salamander (Ambystoma maculatum), often a focal pond-breeding amphibian of CS and conservation programmes in the United States.
Papers & Reports Linking variability in climate to wetland habitat suitability: is it possible to forecast regional responses from simple climate measures?
Authors: Courtney L Davis; David AW Miller; Evan HC Grant; Brian J Halstead; Patrick M Kleeman; Susan C Walls; William J Barichivich
Date: 2018-11-17 | Outlet: Wetlands Ecology and Management
Temporary wetlands have value to both ecological and social systems. Interactions between local climate and the surrounding landscape result in patterns of hydrology that are unique to temporary wetlands. These seasonal and annual fluctuations in wetland inundation contribute to community composition and richness. Thus, predicting wetland community responses to environmental change is tied to the ability to predict wetland hydroregime. Detailed monitoring of wetland hydroregime is resource-intensive, limiting the scope and scale of forecasting. As an alternative, we determine which freely available measures of water availability best predict one component of wetland hydroregime, habitat suitability (i.e., the predictability of water in a wetland) within and among geographic regions. We used data from three North American regions to determine the climate index that best explained year-to-year variation in habitat suitability during a key phenological period—amphibian breeding. We demonstrate that simple, short-term climate indices based solely on precipitation data best predict habitat suitability in vernal pools in the northeast, montane wetlands in the west and coastal plain wetlands in the southeast. These relationships can help understand how changes in short-term precipitation patterns as a result of climate change may influence the overall hydroregime, and resulting biodiversity, of temporary wetlands across disparate biomes.
Papers & Reports Batrachochytrium slamandrivorans (Bsal) in Appalachia: using scenario building to proactively prepare for a wildlife disease outbreak caused by an invasive amphibian chytrid fungus
Authors: Maria-Richetta C Hopkins; Michael J Adams; P E Super; Deanna H Olson; C R Hickman; P English; L Sprague; I B Maska; A B Pennaz; K A Ludwig
Date: 2018-11-05 | Outlet: U.S. Geological Survey Open-File Report 2018-1150
Batrachochytrium salamandrivorans (Bsal), a pathogenic chytrid fungus, is nonnative to the United States and poses a disease threat to vulnerable amphibian hosts. The Bsal fungus may lead to increases in Threatened, Endangered, and Sensitive status listings at local, state, and federal levels, resulting in financial costs associated with implementing the Endangered Species Act . The U.S. is a global biodiversity hotspot for salamanders, an order of amphibians that is particularly vulnerable to developing a disease called chytridiomycosis when exposed to Bsal. Published Bsal risk assessments for North America have suggested that salamanders within the Appalachian region of the U.S. are at a high risk. In May 2017, a workshop was facilitated by the Department of the Interior?s (DOI) Strategic Sciences Group (SSG). A discussion-based incident-response exercise focused on a hypothetical Bsal disease outbreak in Appalachia was led by U.S. Geological Survey (USGS) staff members. Participants included representatives of the Eastern Band of the Cherokee Indians, the U.S. Fish and Wildlife Service (USFWS), National Park Service, Appalachian Landscape Conservation Cooperative, Tennessee Wildlife Resources Agency, and U.S. Department of Agriculture?s U.S. Forest Service. Scenario-building was utilized to brainstorm cascading consequences (social, economic and ecological) of a Bsal disease outbreak in this region of Appalachia. This report highlights the management and science actions that should could be undertaken to ensure an effective, rapid response to a Bsal introduction to the United States.
Papers & Reports Managing the trifecta of disease, climate, and contaminants: Searching for robust choices under multiple sources of uncertainty
Authors: Kelly L Smalling; Collin A Eagles-Smith; R A Katz; Evan HC Grant
Date: 2019-05-30 | Outlet: Biological Conservation 236: 153-161
Amphibian populations are exposed to multiple stressors, with potential for synergistic effects. These synergies can increase uncertainty in our ability to characterize the effects of each stressor and to understand the degree to which their effects interact to impact population processes. This uncertainty challenges our ability to identify appropriate management alternatives. Finding solutions that are robust to these uncertainties can improve management when knowledge is absent or equivocal and identify critical knowledge gaps. Bayesian Belief Networks (BBNs) are probabilistic graphical models that explicitly account for various sources of uncertainty and are used increasingly by environmental practitioners because of their broad applicability to ecological risk assessments. BBNs allow the user to: 1) generate a conceptual model to link actions to outcomes, 2) use a variety of source data (empirical or expert opinion), 3) explore robust management strategies under uncertainty, 4) use sensitivity analysis to identify opportunities for developing new management actions, and 5) guide the design of data collection for monitoring to improve management decisions. BBNs contribute considerably to environmental research and management because they are transparent and treat uncertainty explicitly. Because of the high level of uncertainty in stressor response, we developed a BBN to conceptually evaluate the effects of potential management actions on amphibian populations exposed to disease, environmental contaminants, and increasingly frequent and severe droughts
Papers & Reports Timing of first and last calls and median calling peaks for Pseudacris crucifer, and of the first call for Hyla chrysoscelis/versicolor, at six wetlands in the St. Croix National Scenic Riverway from 2008-2012
Authors: Walt J Sadinski; Mark F Roth
Date: 2018-09-06 | Outlet: U.S. Geological Survey data release, https://doi.org/10.5066/F7CR5SBH.
To better understand relations of annual calling phenophases for Pseudacris crucifer, and of the first calls of the season for Hyla chrysoscelis/versicolor, to the timing of the start of the calling season, we compared these dynamics for six wetlands in the St. Croix National Scenic Riverway from 2008 to 2012. We installed an acoustic recorder at each site prior to the start of each calling season and programmed it to record for five minutes at the top of every hour until late summer. We then used the Songscape option in Songscope software to generate annual summaries of all acoustic files recorded at each site. We created contour plots of the summarized median dB values across bandwidths in each recording and then assessed individual calls and calling peaks by visually examining these plots to identify first (and last) calls via the unique call signatures for these two species. We examined individual five-minute recordings aurally and visually as necessary when sound images represented on the contour plots were confounded and to ensure that the calling peaks described below were dates when calling activity was relatively intense. We also determined the daily median dB levels for frequencies across 2900 to 3200 Hz during 2100 to 2300 h, the bandwidth that typically encompassed the primary energy peak in P. crucifer calls and a time period during which P. crucifer typically called most consistently throughout their calling season. We did this for each day from the date when P. crucifer first called during each year to the date when they last called during each year. Because calling activity could vary from one hour to the next, we integrated the area under the curve for the daily median dB levels from 2900 to 3200 Hz during 2100 to 2300 h. We removed dates when overlapping sounds from storms or other sources rendered comparisons to calls of P. crucifer inaccurate. We used the resultant set of integrands to represent the relative sound intensity (as an indicator of calling activity) for P. crucifer across those hours for each date. We then used these integrands to determine the three highest peak calling dates for this species and used the median of those three dates as the overall median peak date for each site in each year.

